Monday, December 30, 2013

Autism Spectrum Disorder and Biomarkers

We used our IFN-gamma and BDNF Sandwich Elisa Kits to test the levels of these biomarkers in the blood serum of 2 individuals with Austism Spectrum Disorder. We anticipated  that BDNF would be significantly up or down regulated and IFN-gamma up regulated as confirmed by the literature. see 10.1371/journal.pone.0020470 , DOI: 10.1371/journal.pone.0020470 and DOI: 10.1111/acps.12071.

Our testing results showed:
Figure 1: ASD and Biomarker Levels

Based on these initial findings we are developing a custom Quantibody® Antibody Array designed for the fine tuned testing of individuals with ASD. The biomarkers included in the array will be: HSP70, TGF-beta2, 
Caspase-7, IFN-gamma and BDNF.

Figure 2: ASD Markers vs Controls

These panels will enable us to determine the severity of ASD. From the results, we will be working with our collaborators to determine potential cell based therapies for improving the symptom and behaviors of ASD sufferers. As part of the therapeutic regimes the panels can then be used check on progress towards "wellness". 

This a key initiative for us in 2014 so stay tuned.

Tuesday, December 17, 2013

hMSCs and Mesen-X Media in Actions

Customer Feedback on Neuromics' Human Mesenchymal Stem Cells

The demand for these UCB derived hMSCs continues to grow. We do everything we can to insure users' success. This includes replacing cells if there are any issues.

It is always great to get documented feedback. Dr. Rodney Nash, CEO of Javeen Biosciences used their new Mesen-X media to grow the cells. This GMP manufactured media is TOTALLY serum and animal free. It is shipped at room temperature and requires no attachment agents.

Here's Dr. Nash's feedback: We recently used the hMSCs derived from Umbilical Cord Blood. Their performance was nothing less than excellent. We were highly impressed with their morphology and their doubling rate. In addition the cells respond very well to accutase and maintain their performance after passaging. We highly recommend this cell line."

Neuromics' hMSCs grown using Mesen-X Media

The poperties of this Media makes it an excellent solution for drug discovery. Neuromics will be distributing in early 2014 so there will be much more data to follow.

Saturday, December 07, 2013

Biochemistry of Hair Loss

Hair Follicle Stem Cells and the WNT Pathway

This publication hit my Radar because it referenced use of our Goat Polyclonal GFRA1 Antibody.


In this study, Researchers use Tbx18Cre knockin mouse line to ablate the Wnt-responsive transcription factor β-catenin specifically in  at E14.5 during the first wave of guard hair follicle formation. In the absence of β-catenin, canonical Wnt signaling is effectively abolished in cell clusters of precursors for the hair follicle dermal papilla (DP). Sox2+ dermal condensates initiate normally; however by E16.5 guard hair follicle numbers are strongly reduced and by E18.5 most whiskers and guard hair follicles are absent, suggesting that active Wnt signaling in dermal condensates is important for hair follicle formation to proceed after induction. To explore the molecular mechanisms by which Wnt signaling in dermal condensates regulates hair follicle formation, we analyze genome-wide the gene expression changes in embryonic β-catenin null DP precursor cells. We find altered expression of several signaling pathway genes, including Fgfs and Activin: Su-Yi Tsai, Rachel Sennett, Amélie Rezza, Carlos Clavel, Laura Grisanti, Roland Zemla, Sara Najam, Michael Rendl Wnt/β-catenin signaling in dermal condensates is required for hair follicle formation. Developmental Biology, Available online 3 December 2013. http://dx.doi.org/10.1016/j.ydbio.2013.11.023

Could manipulating PDs be the answer for halting hair loss or better yet reverse the process? This research moves us closer.

Sunday, December 01, 2013

In vivo Like Cell Based Assays!

Save 100 USD on our Potent, Pure and Easy to Culture Stem and Progenitor Cells

We continue to design in vivo like behaviors into our  Cell Based Assays.
Our goal is to enable you to make better research decisions earlier
in your discovery process.

These assays are engineered using our proven, potent and easy to culture eSC and Adult Human Stem Cells and Progenitors.

UCB Derived hMSC differentiated to Osteoblast. Note the calcium depositions.

***December Promotions-New Products-Save 100 USD+ 
on Primary and Stem Cells, Media, Markers and Growth Factors***
I'll be posting videos of our in vivo like assays with specific quantitative data here soon.

Sunday, November 24, 2013

Microelectrodes for On-Chip Manipulation of Human Mesenchymal Stem Cells

Amping up Osteogenesis Assays for Drug Discovery

Neuromics and Vitrobiopharma are developing kinetic, differentiation asssays for improving the Drug Discovery process for Osteo-related diseases like Osteoporosis and Osteoarthritis. We have the ability to develop in vivo like assays with quantitative endpoints. The foundation of these assays are potent, easy to culture and cost effective Human Mesenchymal Stem Cells (hMCSCs).

I wanted to share an excellent study using our hMSCs for Osteogenesis Assays: Hsiao, Y.-S., Kuo, C.-W. and Chen, P. (2013), Multifunctional Graphene–PEDOT Microelectrodes for On-Chip Manipulation of Human Mesenchymal Stem Cells. Adv. Funct. Mater., 23: 4649–4656. doi: 10.1002/adfm.201203631. This represents a novel approach for Osteogenesis Assays and illustrates the capabilities of our hMSCs.
Absract: All-solution-processed multifunctional organic bioelectronics composed of reduced graphene oxide (rGO) and dexamethasone 21-phosphate disodium salt (DEX)-loaded poly(3,4-ethylenedioxythiophene) (PEDOT) microelectrode arrays on indium tin oxide glass are reported. They can be used to manipulate the differentiation of human mesenchymal stem cells (hMSCs). In the devices, the rGO material functions as an adhesive coating to promote the adhesion and alignment of hMSC cells and to accelerate their osteogenic differentiation. The poly(L-lysine-graft-ethylene glycol) (PLL-g-PEG)-coated PEDOT electrodes serve as electroactive drug-releasing electrodes. In addition, the corresponding three-zone parallel devices operate as efficient drug-releasing components through spatial-temporal control of the release of the drug DEX from the PEDOT matrix. Such devices can be used for long-term cell culturing and controlled differentiation of hMSCs through electrical stimulation.

Protocols: The hMSCs (Neuromics, Edina, MN) used in experiments were at passage 3-9. Each passage of hMSCs was maintained on the TCPS dishes with a pre-coating of Geltrex reduced growth factor basement membrane matrix (Invitrogen, CIBCO, NY). All hMSCs were maintained in the growth medium, Dulbecco's modified Eagle's medium-low glucose (DMEM-LG) supplemented with mesenchymal cell growth supplement (MSCGM, Lonza) containing L-glutamine, penicillin, and streptomycin, and incubated in an atmosphere containing 5% CO2 at 37 °C. The medium was replenished every 3 to 4 days. For osteogenic differentiation, the hMSCs were cultured in the osteogenesis induction medium, DMEM-LG supplemented with mesenchymal stem cell osteogenesis kit (Chemicon, Cat. No. SCR028), and incubated on the TCPS dishes (control) and test devices. To study the drug release from the devices, hMSCs were cultured in the osteogenesis induction medium in the absence of DEX. The fresh medium was replaced every 2 to 3 days.


Figure: a–d) Osteocalcin expression in hMSCs cultured on rGO–PEDOT microelectrode arrays of various sizes (rGO–PEDOT-20, rGO–PEDOT-50, rGO–PEDOT-100), revealed through immunofluorescence staining. Cells were cultured for 9 days in osteogenesis induction medium in the absence of DEX; drug release was modulated electrically through three cycles of ES (three-day interval); osteocalcin (green) revealed the bone matrix and DAPI (blue) revealed the nucleus. e) Enlarged view of immunofluorescence of osteocalcin expression in hMSCs cultured on rGO–PEDOT-100. Arrows indicated the formation of bone matrix nodules. Scale bar: 100 μm. f) Schematic representation of some bioelectronic features integrated into our rGO–PEDOT devices. doi: 10.1002/adfm.201203631

Conclusion: Authors explored the effect of the dimensions of the rGO–PEDOT microelectrode arrays on the cell spreading and expression of differentiation; whereas the smaller rGO–PEDOT-20 array exhibited better cell alignment ability, the larger rGO–PEDOT-100 exhibited better performance at inducing osteocalcin expression in hMSCs. They also found that using three-zone parallel devices made it possible to release drugs at three points in time. This concept could presumably be extended to release different types of drugs at different lineages on defined patterns. Eventually, such devices might be applicable in tissue engineering and regenerative medicine.

I plan on frequent updates on ours and others development of Osteogenesis Assays for Drug Discovery.

Wednesday, November 20, 2013

Neurotrack Player, Essen Bioscience & Neuromics Neurons

I claim that our solutions are thoroughly tested, validated and research ready. We measure our performance by making sure this claim rings true with our customers.

One way this is confirmed to me is when a partner has success using one of our solutions in a new way. With that I am pleased to update you on Essen Bioscience's application for our primary neurons. Please note the related assays are being demonstrated in their most current webinar.

We will be featuring kinetic and migration assays using our hMSCs, hOsteoblasts and hChondrocytes in the near future. So stay tuned.

Friday, November 01, 2013

SMG-1 and Parkinson's Disease (PD)

Absence of SMG1 protein could lead to PD


A new study has suggested that the absence of a protein called SMG1 - identified as a Regulator of Parkinson's disease-associated alpha-Synuclein-could aid in the development of Parkinson's and other related neurological disorders.

In light of these findings, we believe SMG1 will have increasing importance for PD Researchers. We now have a solid marker for this protein.


Image: Immunoperoxidase of monoclonal antibody to SMG1 on formalin-fixed paraffin-embedded human adrenal gland. [antibody concentration 1.5 ug/ml inset: : Western blot of SMG1 expression in HeLa NE.

Please check out our comprehensive catalog of markers for Parkinson's.

Friday, October 25, 2013

Our Antibody Arrays and ELISA Manufacturing Partner Receives ISO Certification

RayBiotech Awarded ISO 13485: 2003 Certification 

Our partner, RayBiotech, provides us Antibody Arrays and ELISA Kits. This should give potential customers confirmation that this kit are rock solid.

 NORCROSS, GA -- (Marketwired) -- 09/11/13 -- RayBiotech, Inc. announced today that the company has been awarded ISO 13485: 2003 certification with respect to its compliance in the manufacture of in vitro diagnostics kits to be provided to the research community. The ISO 13485 award applies to multivariant antibody arrays, enzyme-linked immunosorbent assays (ELISAs) as well as membrane and glass format arrays and reagents. ISO 13485 is the International Organization for Standardization's certification that the fundamentals of quality management are in place and actively implemented as formal systems within the organization. The ISO 13485 compliance certification is in addition to the company's formal compliance under Good Laboratory Practices (GLP) and Good Manufacturing Practices (GMP), and it further confirms RayBiotech's commitment to quality control and quality assurance for all of its products and services.
Figure: Multiplex antibody arrays-how they work

We will be posting customers feedback on Bazaarify as they becomes available.

Wednesday, October 23, 2013

CIRM Stem Cell Research Updates: Autism syndrome modeled in lab dish points to futu...

CIRM Stem Cell Research Updates: Autism syndrome modeled in lab dish points to futu...: Here's a major stumbling block in developing therapies for human diseases -- ..Here's a major stumbling block in developing therapies for human diseases -- it's hard to find a fix if you don't really know what's wrong. Take autism spectrum disorders. By now doctors are pretty good at identifying signs of the disease, but without access to brain cells researchers don't really know what's going wrong.


This work is being done by Dr. Ricardo Dolmetsch and his team at Stanford. They are particularly interested in understanding how electrical activity and calcium signals control the development of the brain and how this is altered in children with autism spectrum disorders.

I plan on posting more here as part of my featuring the work of key Autism Researchers like Dr. Valerie Hu at GWU. She will also be featured on my "News Behind the Neuroscience News" Blog at www.neuromics.net.

Saturday, October 12, 2013

P2X3 Receptor and Inflammatory Nociception

P2X3 Activates TRPA1, 5-HT3 and 5-HT1A Receptors

Endogenous ATP via activation of P2X3 Receptors contributes to inflammatory nociception in different models, including the formalin injected in subcutaneous tissue of the rat's hind paw. In this study, researchers evaluated whether TRPA1, 5-HT3 and 5-HT1A receptors, whose activation is essential to formalin-induced inflammatory nociception, are involved in the nociception induced by activation of P2X3 receptors on subcutaneous tissue of the rat's hind paw: Suzy Krimon, Dionéia Araldi, Filipe César do Prado, Cláudia Herrera Tambeli, Maria Cláudia G. Oliveira-Fusaro, Carlos Amílcar Parada. P2X3 receptors induced inflammatory nociception modulated by TRPA1, 5-HT3 and 5-HT1A receptors. Pharmacology Biochemistry and Behavior, Available online 8 October 2013. http://dx.doi.org/10.1016/j.pbb.2013.09.017. Our widely used and frequently published P2X3 R Antibody places a central role in measuring the expression of the protein...containing 5% non-fat dry milk at room temperature, followed by incubation with P2X3 rabbit polyclonal antibody (1:500; Neuromics) overnight at 4 °C, rinsed six times with TBST, and then incubated for 40 minutes in goat anti-rabbit IgG peroxidase...
Image: Neuromics' P2X3 R WB Example: Sequence‐specific siRNA‐mediated repression of P2X3. (A) P2X3 mRNA inhibition by 200 nM siRNA duplexes. Twenty‐four hours after transfection of CHO‐rP2X3 cells, P2X3‐specific mRNA was measured with Q‐PCR and plotted as percentage of mRNA detected in the control treated with Oligofectamine alone. Sequences and modifications are shown in Figure 1B and Table 1. (B) P2X3 protein reduction by 200 nM siRNA‐8646/8647, but not by its mismatch analogue siRNA‐MM‐7558/7559 or the unrelated siRNA‐7126/7127. Twenty‐four hours after transfection, protein was extracted and analysed by western blotting. P2X3‐specific immunodetection reveals expression levels as shown below (an average value from two experiments). Time points as indicated at the top. Molecular weights of two glycosylated forms of P2X3 are shown on the left. 

Conclusions: Nociceptive response intensity was measured by observing the rat's behavior and considering the number of times the animal reflexively raised its hind paw (flinches) in 60 min. Local subcutaneous administration of the selective TRPA1, 5-HT3 or 5-HT1A receptor antagonists HC 030031, tropisetron and WAY 100,135, respectively, prevented the nociceptive responses induced by the administration in the same site of the non-selective P2X3 receptor agonist αβmeATP. Administration of the selective P2X3 and P2X2/3 receptor antagonist A-317491 or pretreatment with oligonucleotides antisense against P2X3 receptor prevented the formalin-induced behavioral nociceptive responses during the first and second phases. Also, the co-administration of a subthreshold dose of αβmeATP with a subthreshold dose of formalin induced nociceptive behavior, which was prevented by local administration of tropisetron, HC 030031 or WAY 100, 135. These findings have demonstrated that the activation of P2X3 receptors induces inflammatory nociception modulated by TRPA1, 5-HT3 and 5-HT1A receptors. Also, they suggest that inflammatory nociception is modulated by the release of endogenous ATP and P2X3 receptor activation, which in turn, increases primary afferent nociceptor susceptibility to the action of inflammatory mediators via interaction with TRPA1, 5-HT3 and 5-HT1A receptors in the peripheral tissue.

I will continue to post pain and inflammation related studies that reference the use of our antibodies.

Friday, September 27, 2013

From Zero to 3-D Cell Based Assays in 15 Minutes

Collagel Hydrogels are Designed to Match Your Cell Types.

We are pleased to add Collagel Hydrogels to our 3-D Cell Based Assay Solutions.

The are 3 different gel types that mimic the different in vivo extracellular environment that your cells experience. You will be able to get really nice adipogenesis with MSCs using our CollaGel Hydrogel Standard. CollaGel Hydrogel Soft is an ideal matrix for growing fibroblast; primary hepatocyte cultures and great for growing smooth muscle cells. CollaGel Hydrogel Soft+ is an ideal matrix for growing nervous cells, veins cells and Hydroxyapatite crystals.

Image: Primary hepatocyte culture in 3D model using our CollaGel Hydrogel. 

Using these gels, you can now form small tube-like structures in combination with Human Umbilical Vein Endothelial Cells (HUVEC) in a 3D model. Our CollaGel Hydrogel can also be used for 3D printing without worrying about the needles in your machine been broken due to the fast gelling process. Collagel Hyrogels can be used for: Stem Cell Behavior Studies Fibrosis Studies,  Cosmetic Toxicology, Hepatocyte Assays, Neuronal Branching, Wound Healing Assays, Cell Invasion Assays, Migration Assays, Cancer Cell Phenotyping and  Bioprinting.

I will be posting Collagel Hydrogel related data and images provided by our customers.

Thursday, September 19, 2013

New Astrocyte-Glial Markers

More Options!

We get a lot of request for markers that will more specifically stain astrocytes, glia and microglia. Let's say, for example, you want to pinpoint these cell types in a mixed neuron-glial culture. You can now do a dual label and generate these results.

Image: Neuron-glial cell mixture cultures stained with  ALDH1L1 (red) and our monoclonal antibody against GFAP (green). Blue is a DNA stain. ALDH1L1 stains astrocytes and excludes from neuron cells. ALDH1L1 stains the astrocytes cell body and processes, whereas GFAP labels the intermediate filament of the cytoskeleton in subset of astrocytes. Astrocytes are positive for both ALDH1L1 and GFAP appear yellow. ALDH1L1 also labels many astrocytes not labeled by GFAP, which appear as red. Inset:Blot of rat liver tissure homogenates blotted with ALDH1L1. The antibody binds strongly a band at ~100 kDa.

Or how about these results:
Image: Mixed neuron-glial cultures stained with Mouse Monoclonal GFAP, and Chicken Polyclonal Neurofilament-NF-L (green). The GFAP antibody stains the network of astrocytes in these cultures, while the NF-L antibody stains neurons and their processes. The blue channel shows the localization of DNA. This antibody also works on formalin fixed paraffin embedded brain tissues. Inset: Strip blot of rat spinal cord protein extract stained with GFAP. A prominent band at about 55 kDa corresponds to the major isoform of GFAP.

We will continue to post new additions to our Neuronal-Glial Markers.

Sunday, September 15, 2013

Antibody Array-ELISA Kits for Cancer Researchers

We continue to build our catalog of Antibody Arrays & ELISA Kits
for Cancer Researchers. Our RayBio® C-Series Ctyokine Arrays
enable you to analyze the expression of up to 120 Cytokines for about
the price of a single ELISA (585 USD).

 Antiboy Array 5
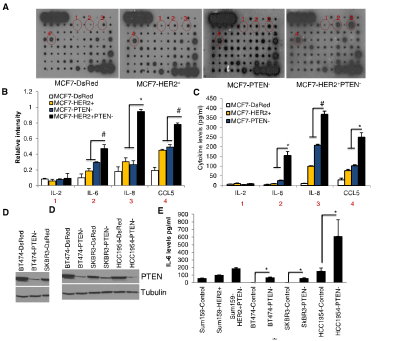
Figure 3. PTEN Downregulation in HER2-Overexpressing Cells Activates an IL6/NF-kB-Mediated Inflammatory Feedback Loop (A–E) MCF7-HER2+PTEN cells secreted 3- to 5-fold higher levels of IL6, IL8, and CCL5 compared to MCF7-HER2+ or MCF7-PTEN cells as determined by RayBio human cytokine antibody Array 5 (A). The intensity of each blot compared to control was determined by Kodak image analyzer (B) and confirmed by ELISA (C). Downregulation of PTEN in HER2-amplified breast cancer cells, BT474, SKBR3, HCC1954, and Sum159-HER2+ (D) results in increased levels of these cytokines in vitro (E). http://dx.doi.org/10.1016/j.molcel.2012.06.014

Array Capabilities:
  • Detects expression of 96 secreted proteins in a single sample, in a single day. 
  • If you can do a Western, you can use a C-Series Antibody Array. And get excellent results the first time!  
  • Sandwich ELISA pairs give C-Series arrays high sensitivity and specificity.  
  • C-Series arrays are compatible with practically ANY liquid sample. 
References have cited using membrane-based C-Series Cytokine Antibody Arrays with nearly every liquid sample type imaginable, including: cell-cultured and co cell cultured media, cell and tissue lysates, tissue/organ perfusates, serum, plasma, urine, and many other body fluids, including cyst, interstitial, synovial, blister, cerebrospinal, prostatic and amniotic fluids, as well as abscesses, broncho-alveolar lavage, sputum, saliva, tears, breath condensates, and even human milk and colostrum. Publications referencing use of our Antibody Arrays.

I will be posting more new developments here.

Monday, September 09, 2013

Stem Cell Markers

Our Stem Cell Reagents our widely used and frequently published. We are proud of the positive feedback on our Stem Cell Markers.
Image: Tuj-1 staining of Neuron-specific class III β-tubulin in differentiated human neural progenitor cells. Cells were stained using goat anti-mouse Alexa Fluor 488 (green) secondary antibody (Molecular Probe, A-11001) and counterstained with PI (red).
Image: Neural progenitors were labeled with anti-rat Nestin polyclonal antibody (Cat#:GT15114) and stained with conjugated donkey anti-goat secondary anti-body (green). Differentiated neurons were labeled with neuron-specific mouse anti-β-III tubulin/ Tuj1-(Cat#MO15013 monoclonal antibody (red). Nuclei were stained with DAPI (blue).

Tuj-1: Customer Publications and Data.

I will continue to post updates.

Tuesday, August 20, 2013

Proud Distributor of RayBiotech's Antibody Arrays and ELISAs

Pioneer and Market Leader

I am pleased to announce we are a distribution partner for RayBiotech. The solutions we offer include Antibody Arrays and ELISA Kits. With these additions, you now have many options for the either the qualitative, semi-quantitative or quantitative measurement of protein expression. From single antibody pair ELISAs to multiplexed arrays. The arrays enable you to simultaneously analyze up to 80 cytokine, inflammatory response, growth factor or angiogenesis related proteins.

In this posting, I focus on our new C-Series Antibody Array Kits. The kits utilize the sandwich immunoassay principle, wherein a panel of capture antibodies is printed on a nitrocellulose membrane solid support (usualy 2.5 cm x 3 cm). The array membranes are processed similarly to a Western blot (chemiluminescent readout). Signals are then visualized on x-ray film or a digital image, allowing densitometry data collection and calculation of fold-changes for each detected protein. The entire procedure can be completed in 1 day, and is simple enough to permit even the novice researcher to successfully collect data with very few pitfalls and little or no optimization.

They are proven and frequently published. You can now analyze the protein expression in you assays for a fraction of the cost of tradition methods. Here's an example: Simona Giorgini, Daniela Trisciuoglio, Chiara Gabellini, Marianna Desideri, Laura Castellini, Cristina Colarossi, Uwe Zangemeister-Wittke, Gabriella Zupi and Donatella Del Bufalo. Modulation of bcl-xL in Tumor Cells Regulates Angiogenesis through CXCL8 Expression. doi: 10.1158/1541-7786.MCR-07-0088. Mol Cancer Res August 2007 5; 7

Figure: bcl-xL overexpression in ADF glioblastoma and M14 melanoma cells increases CXCL8 expression. Image of membranes from a protein array. Membranes are probed with CM from the (A) glioblastoma control (AN8) and bcl-xL–overexpressing (AXL42 and AXL74) clones and (B) melanoma control (Mneo) and bcl-xL–overexpressing (MXL12 and MXL90) clones. In the negative control (NEG), the CM is replaced with an appropriate mock buffer according to array protocol. The intensity of protein signals for each membrane was compared with the relative positive signals by densitometric analysis. C. Schematic representation of proangiogenic factors that can be detected by the use of the membrane. The CXCL8, TGF-1β, TIMP1, TIMP2, and VEGF protein signals (two spots) are indicated by red, blue, yellow, violet, and green rectangles, respectively, in each image....The Human Angiogenesis Antibody Array I (RayBiotech. Inc.) was used according to the manufacturer's protocol to evaluate the secretion of 20 angiogenic factors into the CM of the different lines. A schematic representation of the proangiogenic factors that may be detected by the use of the array has been reported in the above figure. Membranes spotted in duplicate with antibodies against angiogenic factors were blocked with blocking buffer and then were incubated overnight with CM. Next, membranes were washed with wash buffer, incubated with biotin-conjugated antibodies against proangiogenic factors, washed with wash buffer, and incubated with horseradish peroxidase–conjugated streptavidin. The signals on the membranes were detected by chemiluminescence. Membranes, blocking and wash buffer, and antibodies against proangiogenic factors were all provided with the kit. The intensity of protein signal (two spots for each protein) was compared with the relative positive signals by densitometric analysis.

Here's an excellent video that provides more detail on Antibody Array Kit capabililities:
I will continue to post information on new addition with related pubs and data.

Monday, August 12, 2013

A Method for 3D Immunostaining and Optical Imaging of the Mouse Brain

Demonstrated in Neural Progenitor Cells

We have proven and effective tools for delivering siRNA, shRNA and miRNA for gene expression analysis and measuring apoptosis in vivo.

We are pleased to introduce a new application for one of our neural progenitor markers. In this study our Chicken Nestin Antibody is used to stain these progenitors in dissected mouse brains: Gleave JA, Lerch JP, Henkelman RM, Nieman BJ (2013) A Method for 3D Immunostaining and Optical Imaging of the Mouse Brain Demonstrated in Neural Progenitor Cells. PLoS ONE 8(8): e72039. doi:10.1371/journal.pone.0072039. 3D antibody staining of adult mouse brains: 1% PFA perfused adult mouse brains were removed from the skull and then divided by removing the cerebellum and separating the hemispheres if desired. The samples were immediately dehydrated in a gradient of methanol solutions to 100% methanol over the course of one day. Immediate dehydration is important to preserve the cellular morphology of the lightly-fixed brain. The samples then underwent freeze/thaw (one hour at –80°C/one hour at room temperature) four times. The samples were rehydrated in a gradient of methanol solutions to PBS over the course of one day. The samples were mildly digested for 5 minutes using 10 mg/ml of Proteinase K (Promega, WI, USA) and then thoroughly washed to remove any residual Proteinase K. Antigen retrieval was performed using a Histos5 histology microwave (Milestone, MI, USA) in 0.01 M sodium citrate buffer pH 6 on an antigen retrieval program (0–90°C 11min, 90–98°C 3min, 98°C 10min). The samples were cooled to RT and subsequently washed in PBS to remove excess buffer. From this point, all incubations were performed in the Histos5 histology microwave. The samples were incubated at 37°C for 48 hours in primary antibody diluted in 5% normal goat serum (Jackson ImmunoResearch, PA, USA), 5% dimethylsulfoxide (DMSO, Fisher Scientific, Ontario, Canada), and 0.01% Triton X-100 (Bioshop Canada, Ontario, Canada). The samples were then washed at 37°C for 48 hours in 5% serum, 0.01% Triton X-100, replacing the solution once after 24 hours. Following this, the samples were incubated for 72 hours in secondary antibody diluted in 5% serum, 5% DMSO, and 0.01% Triton X-100. Finally, the samples were washed at 37°C for 48 hours in 0.01% Triton X-100, replacing the solution once after 24 hours.

Staining of single hemisphere brain samples using the described protocol for 3D imaging included the following: doublecortin (n = 4), GFAP (n = 4), nestin (n = 3), double stain of doublecortin and nestin (n = 1). Doublecortin was also used to stain a full mouse brain excluding the cerebellum (n = 2). Control samples were generated using pre-absorbed primary antibodies when possible by incubating the primary antibody with a blocking peptide for 30 minutes at room temperature prior to staining. If no peptide for the primary antibody was available, the staining procedure was performed in the control except that the primary antibody was omitted during the appropriate step.

Staining was performed with the following antibodies: rabbit anti-doublecortin (Abcam), goat anti-doublecortin and peptide (Santa Cruz Biotechnology) rabbit anti-GFAP (Dako), chicken anti-nestin (Neuromics), goat anti-rabbit alexafluor 546 (Invitrogen), goat anti-rabbit alexafluor 488 (Invitrogen), goat anti-rabbit alexafluor 647 (Invitrogen), goat anti-chicken alexafluor 546 (Invitrogen), goat anti-chicken alexafluor 488 (Invitrogen), donkey anti-goat alexafluor 546 (Invitrogen), donkey anti-goat alexafluor 488 (Invitrogen).


Images: Validation of 3D nestin staining. Cryosections cut from a stained brain hemisphere show nestin-positive cells (red; arrows, A). Some additional punctate fluorescence was present (arrowheads, A). The sections were re-probed with a secondary antibody (green; A) to highlight primary antibody left unbound by secondary antibody. No evidence of primary antibody left unbound by secondary antibody was found. Sections were also re-stained with both primary and secondary antibodies (B) to highlight primary-antibody antigen sites unoccupied. There is overlap of the original 3D nestin stain with the 2D re-stain (arrowheads). LV = Lateral ventricle, scalebars = 100 µm. doi:10.1371/journal.pone.0072039.g003

The best news of all: This staining method is simple, using a combination of heat, time and specimen preparation procedures readily available, so that it can be easily implemented without the need for specialized equipment, making it accessible to most laboratories.

Tuesday, August 06, 2013

Healthy and Happy Neuron/Astrocytes Cultures

A Track Record of Customer Success

Neuromics is  recognized for the quality of  hNP1™ Human Neural Progenitor,  hN2™ Neuron Discovery Kits, E18 and E20 Rat Primary Neurons and E18 Rat Primary Astroglia. As the company owner, it is important that I keep my finger on the pulse of how well they work for each and every unique application. I personally follow up with each user and if there are any issues, we replace the cells once free of charge. Your success is critical to our growth.

I wanted to share with you recent references. These give and excellent snapshot of the exciting ways our cells can used. Alexzander Asea, Punit Kaur, Alexander Panossian, Karl Georg Wikman, Evaluation of molecular chaperons Hsp72 and neuropeptide Y as characteristic markers of adaptogenic activity of plant extracts. Phytomedicine, Available online 6 August 2013, ISSN 0944-7113, http://dx.doi.org/10.1016/j.phymed.2013.07.001
...using trypan blue exclusion test and routinely found to contain less than ;5% dead cells. Primary human neurons were purchased from Neuromics (Edina, MN)...

Images: Micropictograph of primary culture from micro-dissected hippocampus. (A) Neurons are round and healthy 1 h after plating on poly-d-lysine substrate. (B) Five days in culture, neurons remain healthy and have extended processes. Magnification 60×. http://dx.doi.org/10.1016/j.phymed.2013.07.001

Todd GK, Boosalis CA, Burzycki AA, Steinman MQ, Hester LD, et al. (2013) Towards Neuronal Organoids: A Method for Long-Term Culturing of High-Density Hippocampal Neurons. PLoS ONE 8(4): e58996. doi:10.1371/journal.pone.0058996
... a protocol that allows for culturing of E18 hippocampal neurons at high densities for more than 120 days. These cultured hippocampal neurons are (i) well differentiated with high numbers of synapses, (ii) anchored securely to their substrate, (iii) have high levels of functional connectivity, and (iv) form dense multi-layered cellular networks. We propose that our culture methodology is likely to be effective for multiple neuronal subtypes–particularly those that can be grown in Neurobasal/B27 media. This methodology presents new avenues for long-term functional studies in neurons...
Xiugong Gao, Hsiuling Lin, Radharaman Ray, Prabhati Ray. Toxicogenomic Studies of Human Neural Cells Following Exposure to Organophosphorus Chemical Warfare Nerve Agent VX. Neurochemical Research. February 2013.
...Human hN2 neurons were obtained from Neuromics...
Image: Staining of hN2 Human Neurons with Tuj 1 (Neuron-specific class III beta-tubulin) (red) and Nestin (green). Counter stained with DAPI (blue). hN2 Cells-Electro Phys Data. 

Xiufang Guo, Severo Spradling, Maria Stancescu, Stephen Lambert, James J. Hickman. Derivation of sensory neurons and neural crest stem cells from human neural progenitor hNP1. Biomaterials, In Press, Corrected Proof,Mar 2013.doi:10.1016/j.biomaterials.2013.02.061
...hNP1, were obtained from Neuromics (Edina, Minnesota)...
Wei Zhang , Radhia Benmohamed, Anthony C. Arvanites, Richard I. Morimoto, Robert J. Ferrante, Donald R. Kirsch, Richard B. Silverman. Cyclohexane 1,3-diones and their inhibition of mutant SOD1-dependent protein aggregation and toxicity in PC12 cells. Bioorganic & Medicinal Chemistry. Elsevier Ltd. All rights reserved.doi:10.1016/j.bmc.2011.11.039.
...Primary rat cortical tissue was purchased from Neuromics Inc., Edina, MN and used to initiate primary cortical neuron cultures. The tissue was isolated from micro-surgically dissected E18 embryonic Sprague/Dawley or Fischer 344 rat brain and shipped in a nutrient rich medium under refrigeration. To isolate neurons, the tissue was incubated with papain at a concentration of 2 mg/mL in Hibernate without calcium for 30 min at 37OC. The enzymatic solution was then removed, and 1 mL of culture media (Neurobasal, B27, 0.5 mM glutamine) was added. A sterile Pasteur pipette was used to gently disperse the cells, which were then washed, re-suspended and counted. The cells were plated on poly-D-lysine coated 96-well plates at a density of 20,000 cells/well and incubated at 37OC in a 5% CO2-humidified atmosphere for 5 days prior to use in compound testing. By microscopic inspection, the resulting cultures consisted of app. 90% neurons...
Majumder A, Dhara SK, Swetenburg R, Mithani M, Cao K, Medrzycki M, Fan Y, Stice SL. Inhibition of DNA methyltransferases and histone deacetylases induces astrocytic differentiation of neural progenitors. Stem Cell Res. 2013 Jul;11(1):574-86. doi: 10.1016/j.scr.2013.03.003. Epub 2013 Apr 2.
...Progenitor to Astrocytes Protocol: For astrocytic differentiation of hNP cells, neuronal differentiation media were supplemented with BMP2 (20 ng/mL) and combinations of Aza-C and TSA; Aza-C (500 nM), TSA (100 nM) and BMP2 (20 ng/mL) for 2 days, with one complete media change in between, followed by differentiation media supplemented with BMP2 but not with Aza-C or TSA. Cells were harvested prior to analysis at 5, 15 or 30 days of treatment or for cryopreservation at d6 or d10 of differentiation. For cryopreservation, cells were dissociated with Accutase™ and frozen in differentiation media containing10% DMSO. Viability was assessed at 30 days in Aza-C and TSA treated cultures by trypan blue exclusion, and datawas acquired using a Cellometer Auto T4® (Nexcelom Biosciences)...
Aparna Talekar, Antonello Pessi, and Matteo Porotto. Infection of primary neurons mediated by Nipah virus envelope proteins: Role of host target cells in antiviral action. J. Virol. doi:10.1128/JVI.00452-11.
...Hippocampus, Cortex and Ventricular Cells (Neuromics)...

I will continue posting results here.

Sunday, July 28, 2013

eSC Derived hNP1 Neural Progenitors Astrocytic Differentiation

Protocol for Driving hNP1TM Human Neural Progenitors to Astrocytes

There is a great demand for an easy way to generate human astrocytes in culture. I am pleased to present a protocol for differentiating our hNP1 Cells to Astrocytes. This comes from my friend Dr. Steve Stice and his team at ArunA Biomedical and University of Georgia: Majumder A, Dhara SK, Swetenburg R, Mithani M, Cao K, Medrzycki M, Fan Y, Stice SL. Inhibition of DNA methyltransferases and histone deacetylases induces astrocytic differentiation of neural progenitors. Stem Cell Res. 2013 Jul;11(1):574-86. doi: 10.1016/j.scr.2013.03.003. Epub 2013 Apr 2.

These enriched non-transformed human astrocyte progenitors will provide a critical cell source to further our understanding of how astrocytes play a pivotal role in neural function and development. Human neural progenitors derived from pluripotent embryonic stem cells and propagated in adherent serum-free cultures provide a fate restricted renewable source for quick production of neural cells; however, such cells are highly refractive to astrocytogenesis and show a strong neurogenic bias, similar to neural progenitors from the early embryonic central nervous system (CNS). We found that several astrocytic genes are hypermethylated in such progenitors potentially preventing generation of astrocytes and leading to the proneuronal fate of these progenitors. However, epigenetic modification by Azacytidine (Aza-C) and Trichostatin A (TSA), with concomitant signaling from BMP2 and LIF in neural progenitor cultures shifts this bias, leading to expression of astrocytic markers as early as 5days of differentiation, with near complete suppression of neuronal differentiation.


Images: Morphology and gene expression after 15 and 30 days of differentiation of cells with astrocytic treatment. Bright field images of hNP cells differentiated (A) with or (B) without astrocytic treatment. A and B compare morphology of cultured cells in treated vs. untreated differentiation at 15 days. Treated and untreated cells were cryopreserved at d6 and subsequently thawed and cultured for an additional 9 days. Flow cytometry analysis to determine percent of GFAP+ and S100B+ cells at d15 of differentiation. Data is presented as histograms for (C) GFAP and (D) S100B with corresponding immunoreactive cells in insets from a parallel culture. Immunocytochemistry detects expression of (E) GFAP with S100B (inset showing distinct staining for both markers), (F) GFAP with GLAST, and (G) GFAP with ALDH1L1 at d30 of differentiation.

The Protocol:  For astrocytic differentiation of hNP cells, neuronal differentiation media were supplemented with BMP2 (20 ng/mL) and combinations of Aza-C and TSA; Aza-C (500 nM), TSA (100 nM) and BMP2 (20 ng/mL) for 2 days, with one complete media change in between, followed by differentiation media supplemented with BMP2 but not with Aza-C or TSA. Cells were harvested prior to analysis at 5, 15 or 30 days of treatment or for cryopreservation at d6 or d10 of differentiation. For cryopreservation, cells were dissociated with Accutase™ and frozen in differentiation media containing10% DMSO. Viability was assessed at 30 days in Aza-C and TSA treated cultures by trypan blue exclusion, and datawas acquired using a Cellometer Auto T4® (Nexcelom Biosciences).

I will keep you updated on new differentiation protocols for our potent, pure and widely used hNP1 Human Neural Progenitors to new phenotypes.

Monday, July 15, 2013

MAP-2-A Versatile Neuron Marker

Neuromics is a leader in providing Neuron-Glial Markers for Neuroscientists.

We are constantly on the search for publications that reference use of these markers in unique applications. In this posting I would like to share a publication where researchers used on of our MAP-2 antibodies to stain medial superior olive (MSO) neurons. Baumann Veronika, Lehnert Simon, Leibold Christian, Koch Ursula. Tonotopic Organization of the Hyperpolarization-activated Current (Ih) in the Mammalian Medial Superior Olive. Front. Neural Circuits 7:117. doi: 10.3389/fncir.2013.00117.
 ...Following recording, slices were fixed in 4% paraformaldehyde for 30 min. After extensive washing in phosphate-buffered saline (PBS) slices were exposed to blocking buffer (0.5% trition X-100/0.1% saponin/1% BSA in PBS) followed by incubation with the primary antibody (chicken anti-microtubule-associated protein 2, MAP2, 1:1000, Neuromics) in blocking buffer. Slices were then rinsed in washing buffer (0.5% Trition X-100/0.1% saponin in PBS) and immunoreactivity was visualized by incubating the slices with the Cy3-conjugated secondary antibody raised in donkey (1:300; Dianova). Finally, slices were washed and mounted on slides with vectashield mounting reagent (Vector Laboratories, USA)...

Here the MAP-2 antibody is used to help identify the dorsal, medial and ventral portion of the MSO of p18 and p22 gerbils.

Figure . Ih varies systematically along the dorsoventral axis. (A) A brain slice containing the MSO with Alexa-488-filled neurons (green) verifies the distribution of the patched neurons along the dorsoventral axis (red: MAP-2). (B) Pharmacologically isolated Ih current traces were elicited by depolarizing and hyperpolarizing voltage steps from −60.5 mV to potentials between −40.5 mV and −120.5 mV for 1 s in 5 mV step increment and then to −100.5 mV for 0.5 s to elicit the tail current to determine the voltage dependence of Ih activation. Current traces are representative for the dorsal, the intermediate and the ventral part of the MSO. (C) I-V relationships of steady-state (red arrow in B) Ih density for ventral (n = 15), intermediate (n = 12) and dorsal (n = 18) neurons emphasize that Ih density amplitudes are smallest in dorsal neurons and largest in ventral neurons (C1). Ih density amplitudes for a voltage step to −110.5 mV (C2). (D) Weighted activation time constants at −110.5 mV (D1). The weighted activation time constants are voltage dependent and largest in the dorsal part of the MSO (D2). (E) The voltage-dependence of Ih activation was measured from the tail current 20 ms after the end of the voltage steps (red arrow) (E1). Values were fitted with a Boltzmann function to obtain the half-maximal activation voltage. In dorsal neurons the Ih activation curve is shifted to more negative voltages (E2). Half-maximal activation voltage was measured in each experiment and averaged (E3). Black symbols: dorsal neurons; gray symbols: intermediate neurons; white symbols: ventral neurons. **P < 0.01, ***P < 0.001, single-factor ANOVA test followed by a Scheffe's post-hoc test.

I will continue to post interesting applications using our Neuron-Glial Markers.

Wednesday, July 03, 2013

Using hESCs to Understand Vasculogenesis Processes

The Role of BMP4 Plays in Regulating Vascular Development

My friend, Dr. Steve Stice and team at UGA have published excellent findings on the process of vasculogenesis: N. L. Boyd, S. K. Dhara, R. Rekaya, E. A. Godbey, K. Hasneen, R. R. Rao, F. D. West III, B. A. Gerwe, S. L. Stice. BMP4 Promotes Formation of Primitive Vascular Networks in Human Embryonic Stem Cell–Derived Embryoid Bodies. Exp Biol Med (Maywood) June 2007 vol. 232 no. 6 833-843.
Highlights:
Human embryonic stem cells (hESC) have the capability to produce all of the cells of the body and have been used as in vitro models to study the molecular signals controlling differentiation and vessel assembly. One such regulatory molecule is bone morphogenetic protein-4 (BMP4), which is required for mesoderm formation and vascular/hematopoietic specification in several species. However, hESC grown in feeder-free conditions and treated with BMP4 differentiate into a cellular phenotype highly expressing a trophoblast gene profile. Therefore, it is unclear what role, if any, BMP4 plays in regulating vascular development in hESC. Here we show in two National Institutes of Health–registered hESC lines (BG02 and WA09) cultured on a 3D substrate of Matrigel in endothelial cell growth medium–2 that the addition of BMP4 (100 ng/ml) for 3 days significantly increases the formation and outgrowth of a network of cells reminiscent of capillary-like structures formed by mature endothelial cells (P < 0.05). Analysis of the expression of 45 genes by quantitative real time–polymerase chain reaction on a low-density array of the entire culture indicates a rapid and significant downregulation of pluripotent and most ectodermal markers with a general upregulation of endoderm, mesoderm, and endothelial markers. Of the genes assayed, BMPR2 and RUNX1 were differentially affected by exposure to BMP4 in both cell lines. Immunocytochemistry indicates the morphological structures formed were negative for the mature endothelial markers CD31 and CD146 as well as the neural marker SOX2, yet positive for the early vascular markers of endothelium (KDR, NESTIN) and smooth muscle cells (α-smooth muscle actin [αSMA]). Together, these data suggest BMP4 can enhance the formation and outgrowth of an immature vascular system.
Figures: Least-squared mean gene expression analysis of BMP4 versus control time course for BGO2 and WA09. BG02 (solid lines) and WA09 (dashed lines) were cultured for 3 days ± BMP4, then for another 5 days in EGM-2 only. Samples were collected on Days 0, 2, 4, 6, and 8; total RNA was extracted, and gene expression was analyzed by qRT-PCR. Least-squared mean comparison was then expressed as x-fold change with respect to Day 0 control. The gene expression time course for (A) OCT4, (B) HEY1, (C) GATA3, (D) NESTIN, (E) SOX2, (F) BMPR2, (G) KDR/Flk1, and (H) CD31/PECAM1 are shown. (BG02: −BMP4 = solid diamond; +BMP4 = solid square; WA09: −BMP4 = open triangle; +BMP4 = open circle; * P < 0.05 for BG02 only; ** P < 0.05 for WA09 only; *** P < 0.05 for both BG02 and WA09).http://ebm.sagepub.com/content/232/6/833.full


Images: Early vascular markers KDR, αSMA, and NESTIN are detected within the network structures and elsewhere. Cell cultures were dual-immunostained to detect co-expression of KDR with αSMA (A–C), KDR with NESTIN (D–F), or αSMA with NESTIN (G–I), and the nucleus was counterstained with DAPI. For each case, three different morphologic regions were represented: the residual EB (A, D, and G), the periphery of the EB (B, E, and H), and the thin network structures (C, F, and I). All images were acquired with a ×40 oil objective, and a Z series stack was projected into a single image. A color figure is available in the online version of the journal.

These findings confirm the use of stem cells and the EB as a model of early development including vasculogenesis (34). Using hESC in this manner can provide insights into the mechanisms regulating the earliest events in human vasculogenesis. An understanding of how the vasculature is formed could also be applied to tissue engineering and angiogenic/ischemic therapies. Note: our Mouse Monoclonal Nestin Antibody is an excellent marker for early vasculogensis of the endothelium.

Tuesday, June 25, 2013

Protocol for Flow Cytometric Sorting of Enriched Neuronal Cultures from iPSCs

Surface molecule profiles undergo dynamic changes in physiology and pathology, serve as markers of cellular state and phenotype and can be exploited for cell selection strategies and diagnostics. The isolation of well-defined cell subsets is needed for in vivo and in vitro applications in stem cell biology. In this technical report, the authors present an approach for defining a subset of interest in a mixed cell population by flow cytometric detection of intracellular antigens. They have developed a fully validated protocol that enables the co-detection of cluster of differentiation (CD) surface antigens on fixed, permeabilized neural cell populations defined by intracellular staining. Determining the degree of co-expression of surface marker candidates with intracellular target population markers (nestin, MAP2, doublecortin, TUJ1) on neuroblastoma cell lines (SH-SY5Y, BE(2)-M17) yielded a combinatorial CD49f-/CD200high surface marker panel. Its application in fluorescence-activated cell sorting (FACS) generated enriched neuronal cultures from differentiated cell suspensions derived from human induced pluripotent stem cells. Our data underlines the feasibility of using the described co-labeling protocol and co-expression analysis for quantitative assays in mammalian neurobiology and for screening approaches to identify much needed surface markers in stem cell biology: Turaç G, Hindley CJ, Thomas R, Davis JA, Deleidi M, et al. (2013) Combined Flow Cytometric Analysis of Surface and Intracellular Antigens Reveals Surface Molecule Markers of Human Neuropoiesis. PLoS ONE 8(6): e68519. doi:10.1371/journal.pone.0068519


Figure 1. Experimental outline. Schematic illustrating the research strategy of identifying novel surface marker combinations on a target population in neural and other stem cell differentiation systems for which intracellular, standard immunocytochemical markers are well established. Following harvesting, the resulting single cell suspension is subject to surface antigen candidate staining, followed by gentle fixation, permeabilization and subsequent co-staining with known intracellular markers. CD markers co-labeling the target population serve as positive markers, those absent on the target population serve as negative markers. In a separate, subsequent step, a combination of the identified positive and/or negative CD markers enables the flow cytometric enrichment of the viable population of interest from a heterogeneous cell suspension for further study and biomedical applications. doi:10.1371/journal.pone.0068519.g001.
Figure 2. Accurate detection of intracellular antigens with optimized fixation-permeabilization conditions preserving surface antigens. Flow cytometric detection of TUJ1, MAP2 and nestin antigens in BJ fibroblasts and the neural SH-SY5Y cell line (A). TUJ1 and nestin are present in both cell lines, while the mature neuronal marker MAP2 was only detected in SH-SY5Y cells (arrows). Note stable fluorescent levels of the negative population, indicating low background staining using this protocol. Representative experiment of three independent repeats shown. (B) Corresponding validation by immunofluorescence analysis. (C) Quantitation of TUJ1, MAP2 and nestin intracellular antigen detection (n=3). Error bars indicate standard deviation. (D) Response of TUJ1 and MAP2 intracellular antigen expression to 6 DIV of 10 µM retinoic acid (RA) treatment of SH-SY5Y cells. Note disappearance/reduction of subsets negative for these markers (upward shift, green arrows), as well as a shift toward CD184low expression with differentiation (blue arrows). doi:10.1371/journal.pone.0068519.g003.

Please note: In addition to the our Human Mouse Monoclonal Nestin Antibody used in the study, we have an extensive catalog of stem cell solutions. I will continue to post highlights of new applications.

Monday, June 17, 2013

Super-Charging Pluripotent Stem Cells

Adapting Stem Cells to Cellular Stress for Regenerative Medicine and Cell-Based Therapies

This approach for the isolation and characterization of a new population of adipose tissue (AT) derived pluripotent stem cells could represent a breakthrough. The authors have identified these cells as "Multilineage Differentiating Stress-Enduring (MUSE) Cells": Heneidi S, Simerman AA, Keller E, Singh P, Li X, et al. (2013) Awakened by Cellular Stress: Isolation and Characterization of a Novel Population of Pluripotent Stem Cells Derived from Human Adipose Tissue. PLoS ONE 8(6): e64752. doi:10.1371/journal.pone.0064752.

Highlights: Although adult stem cells have been considered an attractive source for cell therapy, their effectiveness and efficiency is hindered by a frequently low survival rate due to their exposure to a high cellular stress environment upon transplantation. This key limitation is observed when utilizing adult stem cells for regenerative purposes, as typical cell engraftment yields are extremely low (less than 3%). This low survival rate limiting in the use of stem cells for therapies.

The authors have developed methods for isolating MUSE Cells that are preconditioned to survive engraftments. These cells display down regulation of genes involved in cell death and survival, embryonic development, organism survival, cellular assembly and organization, mitosis, DNA replication, recombination and repair.
Figure 1. Isolation and morphologic characterization of Muse-ATs. (A) Schematic of Muse-AT isolation and activation from their quiescent state by exposure to cellular stress. Muse-AT cells were obtained after 16 hours, with incubation with collagenase in DMEM medium without FCS at 4°C under very low O2 (See Methods). (B) FACS analysis demonstrates that 90% of isolated cells are both SSEA3 and CD105 positive. (C) Muse-AT cells can grow in suspension, forming spheres or cell clusters as well as individual cells (see red arrows) or (D) Muse-AT cells can adhere to the dish and form cell aggregates. Under both conditions, individual Muse-AT cells reached a diameter of approximately 10µm and cell clusters reached a diameter of up to 50µm, correlating to stem cell proliferative size capacity. doi:10.1371/journal.pone.0064752.g001.

Muse-AT cell isolation requires a simple yet highly efficient purification technique, Muse-AT cells could provide an ideal source of pluripotent-like stem cells with the potential to have a critical impact on regenerative medicine and cell-based therapy. The capabilities of these cells need to be further validate. I will keep you posted.

Thursday, June 06, 2013

mGluR5 and Fragile-X Syndrome (FXS)

Upregulation of mGluR5 uncovered in postmortem prefrontal cortex of 14 FXS patients

We are proud that our mGluR5 antibody was selected for this important study. The investigators found that mGluR5 binding density and protein expression were increased in the brains of FXS patients or carriers: Talakad G Lohith, Emily K Osterweil, Masahiro Fujita, Kimberly J Jenko, Mark F Bear, Robert B Innis. Is metabotropic glutamate receptor 5 upregulated in prefrontal cortex in fragile X syndrome? Molecular Autism 2013, 4:15 (24 May 2013).

Protocol: Tissue samples were homogenized using a mortar and pestle in fresh ice-cold, 50 mM Tris– HCl buffer (1:10 w/v) completing 3 × 10 passes with cooling on ice between homogenizations. Homogenates were centrifuged at 20,000g and 4°C for 25 minutes,followed by removal of the supernatant. Pellets were then resuspended in fresh ice-cold 50 mM Tris–HCl buffer and centrifuged again at the same settings. Pellets were resuspended in fresh ice-cold 50 mM Tris–HCl buffer at a protein concentration of approximately 1 mg of protein/mL. Aliquots were stored in a freezer at −80°C until further use. Protein concentrations were determined using the Bradford protein assay (Bio-Rad, Hercules, CA), and absorption was read at 595 nm.

Figure: mGluR5 receptor density and expression in prefrontal cortex of FXS individuals and healthy controls. (A) Binding curves from homologous competition binding of 0.48 nM of [3H] MPEPy to membrane preparation from FXS and control subject samples at concentrations of unlabeled MPEPy ranging from 0.1 nM to 1μM. Individual binding curves were obtained from the average of triplicate measurements for e ach unlabeled ligand concentration. Data represent mean ± standard error in the mean from 14 FXS patients or carriers (FX) and 17 healthy controls (HC). At low concentration of unlabeled ligand, specific binding was higher for FXS than control samples. (B) Results of unpaired t-test tocompare the two groups. mGluR5 density tended to be higher (+16%;P = 0.058) in FXS patients than in the control group. Data represent mean ± standard deviation. Solid triangles (▲) in the FX group indicate the location of three FXS carriers; semisolid triang les indicate the location of a carrier with FXTAS. (C) Representative immunoblot for mGluR5. The mGluR5 band intensity was stronger for the FXS than control subject. Total protein stain of the same lanes confirmed equal-protein loading. (D) Average mGluR5: total protein ratio normalized to control subjects. The ratio was high and marginally significant (+32%; P=0.048) for the FXS group compared with controls. Data represent mean ± standard deviation.Solid triangles (▲) in the FX group indicate the location of three FXS carriers; semisolid triangles indicate the location of a carrier with FXTAS.
Conclusions:
This study was the first to identify upregulation of mGluR5 density and expression in the prefrontal cortex of FXS patients or carriers compared to an age- and sex-matched control group. This is consistent with several studies in FXS model mice that postulate that the syndromic features of FXS are caused by an upregulated mGluR5 signaling pathway. Although the sample size was relatively small and the results could be secondary to prior medication treatment, these initial findings provide strong rationale for measuring mGluR5 in live patients using PET. Such in-vivo studies could measure mGluR5 in all brain regions; the results could also be correlated with treatment response to mGluR5 negative allosteric modulators.

Monday, May 27, 2013

Quantibody® Cytokine Arrays

Cytokines, Adipokines, Growth Factors and Neurotrophins

We are pleased to announce addition of Antibody Arrays to our catalog. These are excellent tools for study apoptosis, inflammation, angiogenesis and  immune response and related autoimmune, inflammatory and degenerative diseases plus many forms of cancers. Check out this video.

Specific Research Applications Include:
•High-throughput profiling of cytokine expression
•Validation of semi-quantitative antibody array results
•Identifying potential molecular targets for drug development
•Identifying the molecular mechanisms of drug action
•Identifying crucial factors involved in disease processes
•Discovering biomarkers for disease management
•Discovering expression patterns for molecular classification of diseases

How Quantibody Arrays Work

We will be aggresively adding new arrays to our product offerings in June. Stay tuned for more.


Saturday, May 25, 2013

Schwann Cell-Sensory Neurons-PNS Markers

Data-Publications
These markers a important tools for the study of Neuro-muscular diseases like Amyotrophic Lateral Sclerosis (ALS) and Multiple Sclerosis (MS).

For Neuromuscular Disease Researchers, we have some of the best Schwann Cell and Sensory/Peripheral Neuron Markers in the business.
Images: Rat mixed neuron/glial cultures stained with Peripherin (green channel) and Neurofilament alpha-internexin/NF66 (green channel). These cultures contain mostly neurons which are rich in alpha-internexin, and a subgroup which have a large amount of peripherin also, such as the prominent cell in the middle of the micrograph. Since this cell expresses large amounts of peripherin and alpha-internexin, the green and red signals superimpose to produce a golden cell. Blue is a DNA stain. Protocol on data-sheet.

Here're recent publications referencing use of these markers:
Leah R. Reznikov, Qian Dong, Jeng-Haur Chena, Thomas O. Moninger, Jung Min Park, Yuzhou Zhang, Jianyang Du, Michael S. Hildebrand, Richard J. H. Smith, Christoph O. Randak, David A. Stoltz, and Michael J. Welsh. CFTR-deficient pigs display peripheral nervous system defects at birth. www.pnas.org/cgi/doi/10.1073/pnas.1222729110...goat anti-p75 (1:500; Neuromics)...

Gayle M. Passmore, Joanne M. Reilly, Matthew Thakur, Vanessa N. Keasberry, Stephen J. Marsh, Anthony H. Dickenson and David A. Brown. Functional significance of M-type potassium channels in nociceptive cutaneous sensory endings. Fronteirs in Molecular Science. doi: 10.3389/fnmol.2012.00063. ...neurofilament H (1:1000,Neuromics,USA)...

Leigh A Nattkemper, Zhong-Qiu Zhao, Anna J Nichols, Alexandru D P Papoiu, Carol A Shively, Zhou-Feng Chen and Gil Yosipovitch. Over-Expression of the Gastrin-Releasing Peptide in Cutaneous Nerve Fibers and its Receptor in Spinal Cord in Primates with Chronic Itch. Journal of Investigative Dermatology accepted article preview 4 April 2013; doi: 10.1038/jid.2013.166...Protein Gene Product 9.5 (PGP9.5; Neuromics, Edina, MN).

Wiebke Kallenborn-Gerhardt, Katrin Schröder, Domenico Del Turco, Ruirui Lu, Katharina Kynast, Judith Kosowski, Ellen Niederberger, Ajay M. Shah, Ralf P. Brandes, Gerd Geisslinger, and Achim Schmidtko. NADPH Oxidase-4 Maintains Neuropathic Pain after Peripheral Nerve Injury. The Journal of Neuroscience, 25 July 2012, 32(30): 10136-10145; doi: 10.1523/​JNEUROSCI.6227-11.2012...chicken anti-P-Zero or MPZ (1:500; Neuromics)...

Images: Micrographs depicting SSeCKS colocalization with myelination markers (CNPase and Pzero). (A) SSeCKS (red) and CNPase (green) in the lumbar spinal cord dorsal horn. The labeling appears discrete with minimal colocalization. (B) SSeCKS (red) and Pzero (green) in the L4 dorsal root ganglia. A lack of co-localization is observed and Pzero can be seen localized to putative axonal elements (arrow). (C) SSeCKS (red) and Pzero (green) in the sciatic nerve. As in the dorsal root ganglia, a lack of co-localization is observed. Both SSeCKS and Pzero can be seen localized to axonal elements. (D) SSeCKS (red) and Pzero (green) in glabrous skin of the hind-paw, fibers displaying colocalization (yellow) can be observed (arrow). Irmen et al. Journal of Brachial Plexus and Peripheral Nerve Injury 2008 3:8 doi:10.1186/1749-7221-3-8.

I will post new data and pubs as they become available.