Thursday, January 26, 2012

Lineage Selection-Neural Stem Cells for SC Grafts

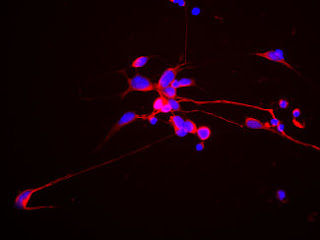
Our Neural Progenitor Markers keep moving up in the "hit parade". These markers are important for lineage selection. This selection is essential to circumvent the possibility of tumor formation and facilitate the safe translation of ES-based therapies to humans.

Here's a recent pub referencing use of several of our markers for selecting or confirming lineage: J. Simon Lunn, Crystal Pacut, Emily Stern, Stacey A. Sakowski, J. Matthew Velkey, Sue O'Shea, Eva Feldman. Intraspinal transplantation of neurogenin-expressing stem cells generates spinal cord neural progenitors. dx.doi.org/10.1016/j.nbd.2011.12.044...Tuj1 (Neuromics, 1:1000), Nestin (Neuromics, 1:500)...
Highlights: Expression of appropriate transcription factors is one approach to direct the differentiation of ES cells towards a specific lineage and stop proliferation. Neural differentiation can be initiated in ES cells by expression of Neurogenin1 (Ngn1). In this study we investigate the effects of controlled Ngn1 expression on mouse ES (mES) cell differentiation in vitro and following grafting into the rat spinal cord. In vitro, Ngn1 expression in mES cells leads to rapid and specific neural differentiation, and a concurrent decrease in proliferation. Similarly transplantation of Ngn1-expressing mES cells into the spinal cord lead to in situ differentiation and spinal precursor formation. These data demonstrate that Ngn1 expression in mES cells is sufficient promote neural differentiation and inhibit proliferation, thus establishing an approach to safely graft ES cells into the spinal cord.

Image: Neural progenitors were labeled with anti-rat Nestin polyclonal antibody (Cat#:GT15114) and stained with conjugated donkey anti-goat secondary anti-body (green). Differentiated neurons were labeled with neuron-specific mouse anti-β-III tubulin/ Tuj1-(Cat#MO15013 monoclonal antibody (red). Nuclei were stained with DAPI (blue).

I will continue to post updates on the application of Neuromics' Stem Cell Markers

Sunday, January 22, 2012

Early Diagnosis of Diabetic Retinopathy

The earlier the diagnosis the better the outcome. This is especially true with autoimmune diseases like Diabetic Retinopathy (DR). DR is the leading cause of blindness among persons of working age in the industrialized world. Here I feature a publication that shows axoglial alterations at the distal portion of the optic nerve could be the first structural change in the diabetic visual pathway. This could prove good news for discovering better therapies thus preventing blindness: Diego C. Fernandez, Laura A. Pasquini, Damián Dorfman, Hernán J. Aldana Marcos, Ruth E. Rosenstein. Early Distal Axonopathy of the Visual Pathway in Experimental Diabetes. doi:10.1016/j.ajpath.2011.09.018

Oligodendrocytes are responsible for insulating axons. Disruptions in the formation of oligodendrocytes could initiate the domino effect that leads to decreasing and eventual total loss of vision. The authors, for example, discovered that in diabetic rats, oligodendrocyte lineage (OL) cells showed hypertrophic somas and a high number of processes.


Images/Data: OL linage evaluation. Immature OL (O1+ cells) and OL precursor (PDGFR-α+ cells) were evaluated by immunostaining and measured as optical density (OD) per section. In the distal ON from animals that were diabetic for 6 weeks, significantly increased O1 and PDGFR-α immunostaining was observed, with the presence of disorganized and hypertrophic cells. Data are mean ± SEM (n = 5 animals per group); *P < 0.01 versus age-matched controls, by Student′s t-test. Scale bar = 50 μm.

At the ultrastructural level, alterations and loss of larger axons were observed in the distal ON from animals that were diabetic for 6 weeks. In these fibers, myelin was highly disorganized, and frequent lamellar membranous bodies were observed.

I will track new develops in this research and post relevant results here.

Monday, January 16, 2012

Primary Neuron Assays for Studying Neurodegeneration

Our goal is to provide our customers and collaborators the tools they need to insure success. This is defined by having the specific Primary Neurons, Growth Factor plus the Markers to meet unique research needs.

The proof is in the results. Here are some highlights.
Images/Data: FIGURE 5. Microglial p38α MAPK-dependent TNFα is involved in LPS-induced neurite degeneration. (A) Photomicrographs of MAP-2 immunocytochemistry show the morphology of neurons after 72h of co-culture with microglia. The arrow points to the appearance of neurites that have been damaged by LPS-activated WT microglia. In contrast, the arrowhead points to the morphological appearance of healthy, undamaged neurites. (B) Diagram of the Sholl method for quantifying the total number of healthy neurites that intersect the concentric circles. (C) Quantification of healthy neurites by the Sholl analysis demonstrates that LPS stimulation of p38α WT microglia in co-culture causes neurite degeneration as seen by a significant reduction in the number of intersections by healthy neurites in the LPS-stimulated group compared to the unstimulated group (white bars). This degeneration can be attenuated by the addition of a blocking antibody to TNFα (5μg/ml), while the non-immune IgG control was not protective (gray bars). Microglia from p38α KO mice stimulated with LPS (black bar) also have significantly less neurite degeneration than the LPS-stimulated p38α WT microglia (white bar). However, by adding TNFα back to the p38α KO microglia co-culture, there is a significant decrease in the healthy neurite arborization compared to the p38α KO microglia stimulated with LPS alone (black bars). (***p<0.005; Bonferroni’s multiple comparison test). Data represents 2 independent experiments. Scale bar equals 25μm. Molecular Neurodegeneration 2011, 6:84 doi:10.1186/1750-1326-6-84
hN2 cells grown in culture for 4 days and stained with our chicken polyclonal to Neurofilament light or low molecular weight chain NF-L, a marker of neurons. Many of the differentiating cells show strong cytoplasmic and clearly fibrillar staining for NF-L. Blue stain is DAPI and reveals cell nuclei of some non neuronal cells in this culture.

We will continue to post relevant images and data that demonstrate our capabilities.

Friday, January 13, 2012

TRPV1s in Action

Our TRPV1s continue to be widely used and published. This recent publication features use out TRPV1-C guinea pig polyclonal for immunohistochemistry and TRPV1-mouse specific for Western Blotting: Sarah E. Canetta, Edlira Luca, Elyse Pertot, Lorna W. Role, David A. Talmage. Type III Nrg1 Back Signaling Enhances Functional TRPV1 along Sensory Axons Contributing to Basal and Inflammatory Thermal Pain Sensation. PLoS ONE 6(9): e25108. doi:10.1371/journal.pone.0025108...IHC: TRPV1 (guinea pig, 1:1000, GP14100 Neuromics); WB: TRPV1 (rabbit, 1:1000, RA14113 Neuromics).


Figure. Sensory axons, but not soma, from Type III Nrg1+/− mice show reduced capsaicin responsiveness compared to axons from WT mice. (A) Representative traces of intracellular calcium along sensory axons in response to 1 µM capsaicin or 56 mM KCl. The change in intracellular calcium from baseline over time ([(F−F0)/F0]*100) is shown for WT (left) and Type III Nrg1+/− (right) axons. Hatched diagonal lines indicate where the time course was non-continuous. (B) Quantification of the maximum change in intracellular calcium in response to application of 1 µM capsaicin or 56 mM KCl by genotype. Averages of 5 animals per genotype were compared using a Student's t-test. Type III Nrg1+/− axons showed a significantly decreased response to capsaicin (p<0.05), but not to KCl, relative to WTs. Graph shows mean±SEM. (C) Type III Nrg1+/− sensory soma show normal response to capsaicin. Quantification of maximal change in fluorescence from baseline ([(F−F0)/F0]*100) in WT or Type III Nrg1+/− sensory neuron soma in response to 1 µM capsaicin or 56 mM KCl. Average responses from 4 WT and 4 Type III Nrg1+/− animals to application of capsaicin or KCl were compared by genotype using a Student's t-test. There was no statistically significant difference between genotypes. Graphs show mean±SEM. (D) Type III Nrg1 (green) and TRPV1 (red) are co-expressed along P21 WT cultured sensory neuron axons identified with a pan-axonal (PA) marker (blue). White arrows indicate examples where Type III Nrg1 and TRPV1 are in close proximity. Scale bar equals 10 µm. (E) P21 WT and Type III Nrg1+/− sensory neuron cultures have equivalent levels of total TRPV1 protein. Total TRPV1 protein measurement by immunoblot. The 95 kD TRPV1 band and the 35 kD GAPDH band are shown from a representative experiment comparing protein from P21 WT and Type III Nrg1+/− cultures. Quantification of fold change in intensity of TRPV1:GAPDH normalized to WT average. There was no statistically significant change in the ratio of TRPV1 to GAPDH between genotypes (WT, Type III Nrg1+/−, n = 3 animals). Genotype comparisons were made using a Student's t-test. Graph shows mean±SEM. doi:10.1371/journal.pone.0025108.g004
All TRPV1 Publications.

Saturday, January 07, 2012

Primary Neurons vs PC12 cells for Compound Testing

This publication compares PC12 Cells vs E18 Primary Cortical Neurons. The cells showed permeability to some key compounds where the Neurons did not. This demonstrates the importance of including primary neurons in compound testing assays for Neuro-disease research: Wei Zhang , Radhia Benmohamed, Anthony C. Arvanites, Richard I. Morimoto, Robert J. Ferrante, Donald R. Kirsch, Richard B. Silverman. Cyclohexane 1,3-diones and their inhibition of mutant SOD1-dependent protein aggregation and toxicity in PC12 cells. Bioorganic & Medicinal Chemistry. Elsevier Ltd. All rights reserved.doi:10.1016/j.bmc.2011.11.039.
Abstract: Amyotrophic lateral sclerosis (ALS) is a fatal neurodegenerative disease characterized by the progressive loss of motor neurons. Currently, there is only one FDA-approved treatment for ALS (riluzole), and that drug only extends life, on average, by 2–3 months. Mutations in Cu/Zn superoxide dismutase (SOD1) are found in familial forms of the disease and have played an important role in the study of ALS pathophysiology. On the basis of their activity in a PC12-G93A-YFP high-throughput screening assay, several bioactive compounds have been identified and classified as cyclohexane-1,3-dione (CHD) derivatives. A concise and efficient synthetic route has been developed to provide diverse CHD analogs. The structural modification of the CHD scaffold led to the discovery of a more potent analog (26) with an EC50 of 700 nM having good pharmacokinetic properties, such as high solubility, low human and mouse metabolic potential, and relatively good plasma stability. It was also found to efficiently penetrate the blood–brain barrier. However, compound 26 did not exhibit any significant life span extension in the ALS mouse model. It was found that, although 26 was active in PC12 cells, it had poor activity in other cell types, including primary cortical neurons, indicating that it can penetrate into the brain, but is not active in neuronal cell potentially due to poor selective cell penetration. Further structural modification of the CHD scaffold was aimed at improving global cell activity as well as maintaining potency. Two new analogs (71 and 73)
were synthesized, which had significantly enhanced cortical neuronal cell permeability, as well as similar
potency to that of 26 in the PC12-G93A assay. These CHD analogs are being investigated further as novel
therapeutic candidates for ALS.
see: Bioorg. Med. Chem. 2011, 19, 613. and J. Med. Chem. 2012, in press

Related Links: Primary Neurons and Astrocytes-Primary human, rat and mouse neurons and astrocytes.

Image: E18 hippocampal neurons stained with Tau (red) and Doublecortin (green). The two proteins overlap in the proximal dendrites (yellow) Axons (low doublecortin content) are red. Blue staining is the nuclear DNA.