Monday, February 22, 2016

Stem Cell "Stemness" and Differentiation States

Markers Play a Key Role

Our Stem Cell Markers are widely used and frequently published. These play an important role for understanding the molecular events that take place during the differentiation of human pluripotent cells. They are essential for the protocols aimed at insuring the generation high of quality differentiated cells.

Here's an excellent study on the determining the state of differentiating stem cells: Julio Castaño, Cristina Morera, Borja Sesé, Stephanie Boue, Carles Bonet-Costa, Merce Martí, Alicia Roque, Albert Jordan, Maria J. Barrero. SETD7 Regulates the Differentiation of Human Embryonic Stem Cells. Published: February 18, 2016DOI: 10.1371/journal.pone.0149502...SOX2 (Neuromics GT15098)...

Figure: SETD7 is expressed at very low levels in pluripotent human cells and induced during differentiation. (A) Average rank of the top 700 most differentially expressed genes between pluripotent (iPSCs or ESCs) and fibroblasts, including those upregulated in pluripotent cells (left panel) and upregulated in fibroblasts (right panel). (B) SETD7 mRNA levels in human ESCs grown under self-renewal conditions (UndES[4]), in vitro differentiated human ESCs (DifES[4]), human fibroblasts (HFF), two lines of human keratinocytes (HEK1 and HEK2) and two lines of iPSCs generated from keratinocytes ([H]KiPS4F and KiPS4F1). Mean and standard deviation of three technical replicates is shown. Induction of SETD7 mRNA levels during ES[4] differentiation was confirmed in more than four independent differentiation experiments. (C) Western blot showing SETD7 protein levels in pluripotent and somatic cells. Loading control beta actin (ACTB) is also shown. (D) Western blot showing protein levels of SETD7, AFP, OCT4 and SOX2 in under self-renewing conditions and in vitro differentiated human ESCs. Loading control alpha tubulin (TUBA) is also shown. One representative experiment out of three is shown. (E) Genomic visualization of the levels of H3K72me3, H3K4me3, H3K4me2, H3K36me3 and RNA polymerase II (Pol II) in the human embryonic stem cell line H1 around the SETD7 gene according to ENCODE. A non-methylated CpG island is depicted in green. (F) Levels of H3K4me2 and H3K27me3 at SETD7 gene promoter region (27 bp upstream of the transcription start site) in pluripotent and somatic cells determined by chromatin immunoprecipitation (ChIP) and ploted relative to the input. IgGs wer used as negative control. Bars show the mean and standard deviation of three independent immunoprecipitations...doi:10.1371/journal.pone.0149502.g001

Neuromics is pleased to provide many different stem cell related options for your cell based assays. I will continue to post updates.

Monday, February 15, 2016

3-D Cell Based Assays Are Evolving

3-D Multicell Models and Gels

There is a growing body of publications of why 3-D matters in drug discovery and toxicology assays. This table shows important distinctions for single cell assays.
Cellular characteristics 2D 3D Refs.
Morphology Sheet-like flat and stretched cells in monolayer Natural shape in spheroid/aggregate structures 20,24,50
Proliferation Often proliferate at a faster rate than in vivo May proliferate at a faster/slower rate compared to 2D-cultured cells depending on cell type and/or type of 3D model system 17,51
Exposure to medium/drugs Cells in monolayer are equally exposed to nutrients/growth factors/drugs that are distributed in growth medium Nutrients and growth factors or drugs may not be able to fully penetrate the spheroid, reaching cells near the core 24,52
Stage of cell cycle More cells are likely to be in the same stage of cell cycle due to being equally exposed to medium Spheroids contain proliferating, quiescent, hypoxic and necrotic cells 18,24,53
Gene/protein expression Often display differential gene and protein expression levels compared to in vivo models Cells often exhibit gene/protein expression profiles more similar to those in vivo tissue origins 17,40,54
Drug sensitivity Cells often succumb to treatment and drugs appear to be very effective Cells are often more resistant to treatment compared to those in 2D culture system, often being better predictors of in vivo drug responses 17,33
Table: Key Differences in Cellular Characteristics and Processes in Two-Dimensional and Three-Dimensional Culture Systems

From the table, we see, for the most part, the overall advantages of cells in 3-D for generating more in vivo like data. We also see potential issues like: "Nutrients and growth factors or drugs may not be able to fully penetrate the spheroid, reaching cells near the core".  

We have resolved penetration issues with our engineered Collagel Hydrogels. We have further enhanced the assays by including multicell assays that even more closely mimic the in vivo environment.

Our Blood Brain Barrier (BBB) Model, for example, includes our:
These cells are pre-cultured in the engineered gels and cost a fraction of the individual components (see: culturing and assay protocol).
Name Catalog #

Size Price
Human Blood Brain Barrier Model 3D45002-6 6 wells
12 well
24 well
$1,780
$2,600
$3,625
Our intention is for you to generate the most in vivo like data possible.

Tuesday, February 09, 2016

Ready to Use Blood Brain Barrier Model (BBB)

6, 12 and 24 Well Options

We are pleased to introduce our BBB Model. It is designed to provide more in vivo like data for your drug discovery and toxicology assays.

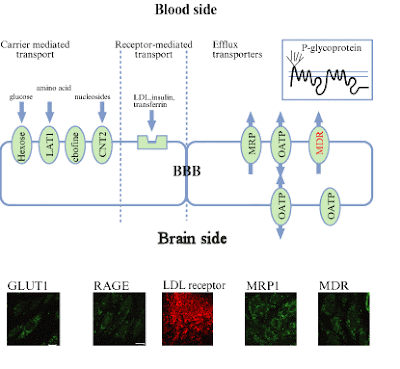
Our model mimic transport properties of the BBB due to the formation of tight junctions, higher expression of specific carriers, or great cell viability. The model includes brain endothelial cells with pericytes and astrocytes layered in an insert. This model improves endothelial cell polarization and enhance the formation of tight junctions, provide better endothelial cell-to-cell contact that is important for barrier development, and prevent the dilution of secreted neurotrophic factors, and these conditions collectively led to the development of an in vitro model that can truly mimic the BBB.
Diagram of BBB Model Transporters
Transport of a molecule (blue) through 3D Human BBB Model in a luminal to basal direction 
Calculation of apparent permeability (Papp in cm/min)
Apparent permeability coefficient Papp (in cm/min) based on the Fick's law can be calculated according to the following equation:
VA: volume of abluminal chamber (cm3)
A: membrane surface area (1.12 cm2)
[C]L: initial luminal tracer concentration (ng/ml)

[C]A : abluminal tracer concentration (ng/ml) t : time of experiment (min)

 Our goal is to provide you better data...at a lower cost.